Data Pipelines & Orchestration: How we tame the chaos of data & make it actually useful
Most data problems do not start with a missing dashboard. They start earlier, when scripts run out of order, failures go unnoticed, retries behave inconsistently, and nobody can explain which upstream process produced a bad number. This article is for engineers who work near data pipelines, operational databases, analytics platforms, or AI systems and need a clearer model for how modern data orchestration turns scattered jobs into observable, reliable workflows.
The central idea is simple: a data pipeline defines what work must happen; an orchestrator defines when, how, and under which conditions that work runs.
From Scheduled Scripts to Operational Complexity
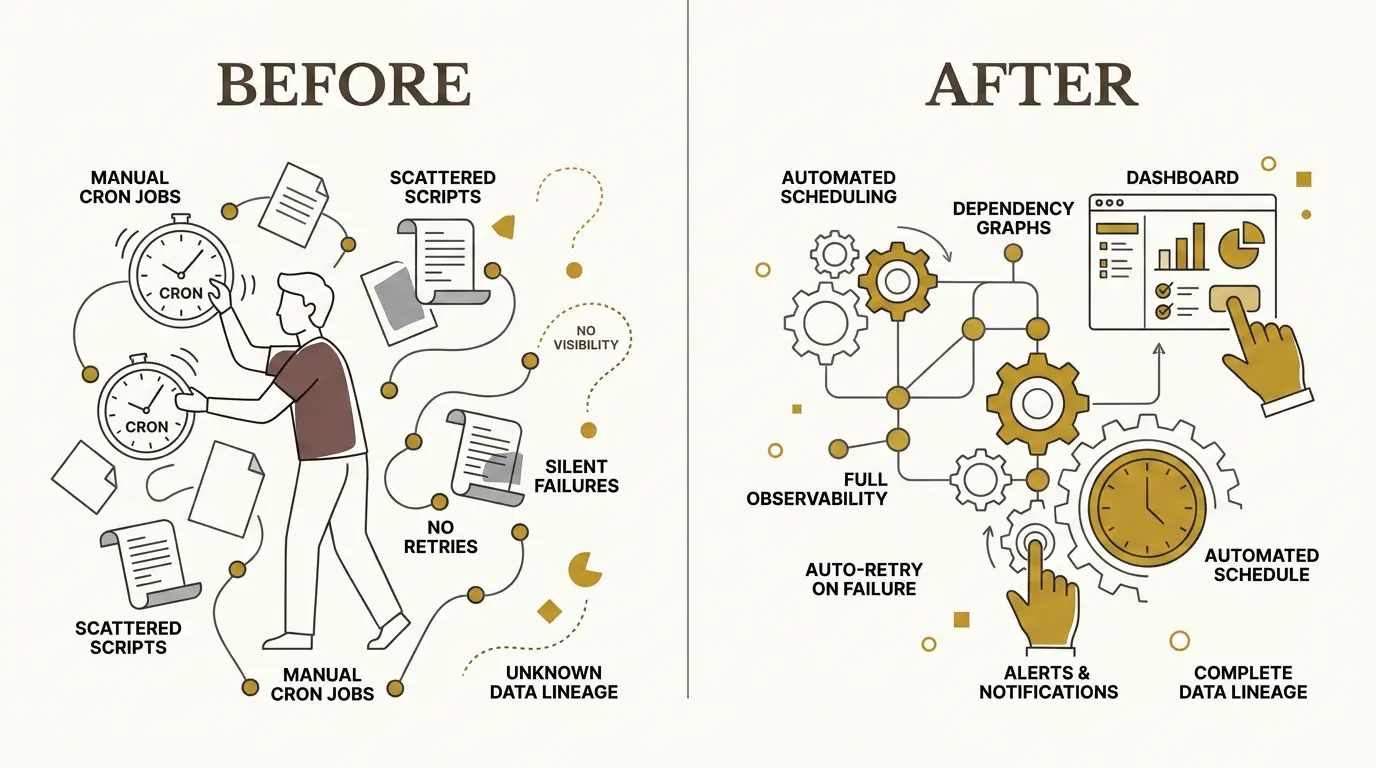
For a long time, scheduled data work was mostly handled with cron jobs, task schedulers, and custom scripts. That works while the system is small. A script extracts data from an API. Another script transforms it. A third script loads a table. Each script logs in its own way, retries in its own way, and fails in its own way.
The problem appears when those scripts stop being independent.
A dashboard can look healthy while the underlying data is wrong. A source system may have changed its schema. A transformation may have silently dropped a column. A load job may have succeeded with stale data. A downstream dashboard may refresh before its upstream table has finished loading.
When a user reports that “the data is wrong,” the engineering question is rarely local. The real question is:
Where in the chain did the data become wrong?
Without orchestration, answering that means manually walking through logs, SQL scripts, job schedules, source systems, transformation code, and dashboard refresh history. This is slow during working hours and worse after a failure that happened overnight.
That is the “3 a.m. problem”: a job fails while nobody is watching, the next morning’s data is stale, and users discover the issue before the system does.
A modern data platform needs more than scheduled execution. It needs dependency management, retries, alerts, lineage, freshness checks, and visibility into the full path from source to consumption.
What Orchestration Actually Does
The word “orchestration” is useful because the orchestrator is not the instrument. It does not necessarily extract the data, transform it, or render the dashboard. Its role is to coordinate the work.
An orchestrator answers operational questions:
- Which task starts first?
- Which tasks can run concurrently?
- Which task depends on which upstream result?
- What happens if one dependency fails?
- Should a failed task retry immediately, retry later, or stop the pipeline?
- Who gets alerted?
- Can we see what data was produced and when?
A data pipeline defines the workload: ingestion, transformation, validation, loading, and downstream refresh. The orchestrator manages execution of that workload.
This distinction matters. Without it, teams tend to bury orchestration logic inside application code. Every service then needs to implement its own scheduling, dependency checks, logging, alerting, retry behavior, and recovery logic. That creates inconsistent operational behavior across the platform.
With an orchestrator, those concerns become explicit and centralized.
Pipelines as Directed Acyclic Graphs
Most orchestration systems model workflows as directed acyclic graphs, usually shortened to DAGs.
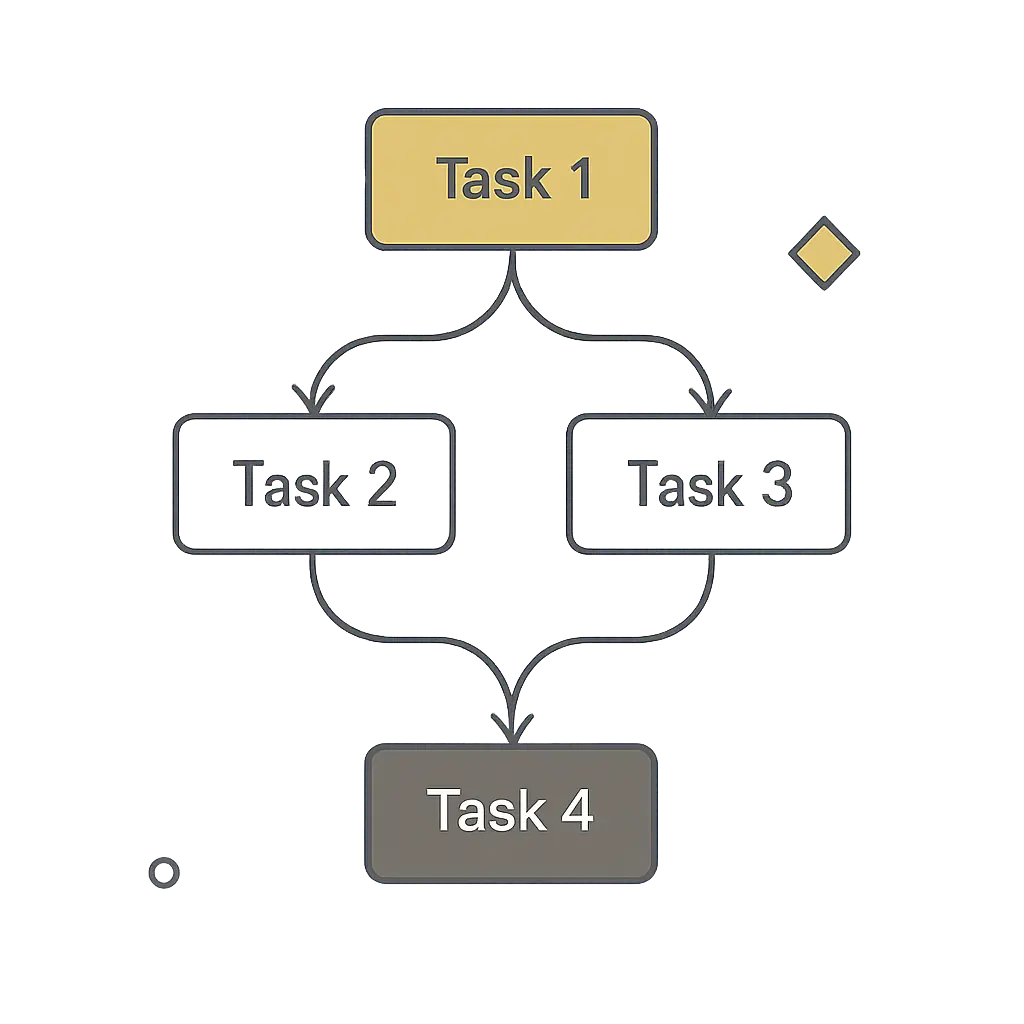
A DAG is a graph of tasks with directional dependencies and no loops. Task 1 can feed Task 2 and Task 3. Task 4 can wait for both Task 2 and Task 3. But Task 4 cannot point back to Task 1 and create a cycle.
This constraint is useful. Data pipelines need a clear execution order. Cycles make it difficult to reason about completion, retries, and correctness.
A DAG also allows concurrency. If two downstream tasks depend on the same upstream extraction but not on each other, they can run in parallel. The orchestrator can then decide whether a later task should wait for all upstream tasks to succeed, continue when only some succeed, or stop on any failure.
For example, imagine a pipeline extracting data from six sources before building a downstream analytical model. If the model is only valid when all six sources are present, then one failed extraction should fail the whole stage. Retrying that failed source with exponential backoff is reasonable. Continuing with five out of six sources may produce a dashboard that looks valid but contains misleading numbers.
A visible failure is better than a silent partial success.
In simple terms, a DAG says: Do these tasks in this order“.
The Modern Data Stack: Collector, Warehouse, Transformer, Orchestrator
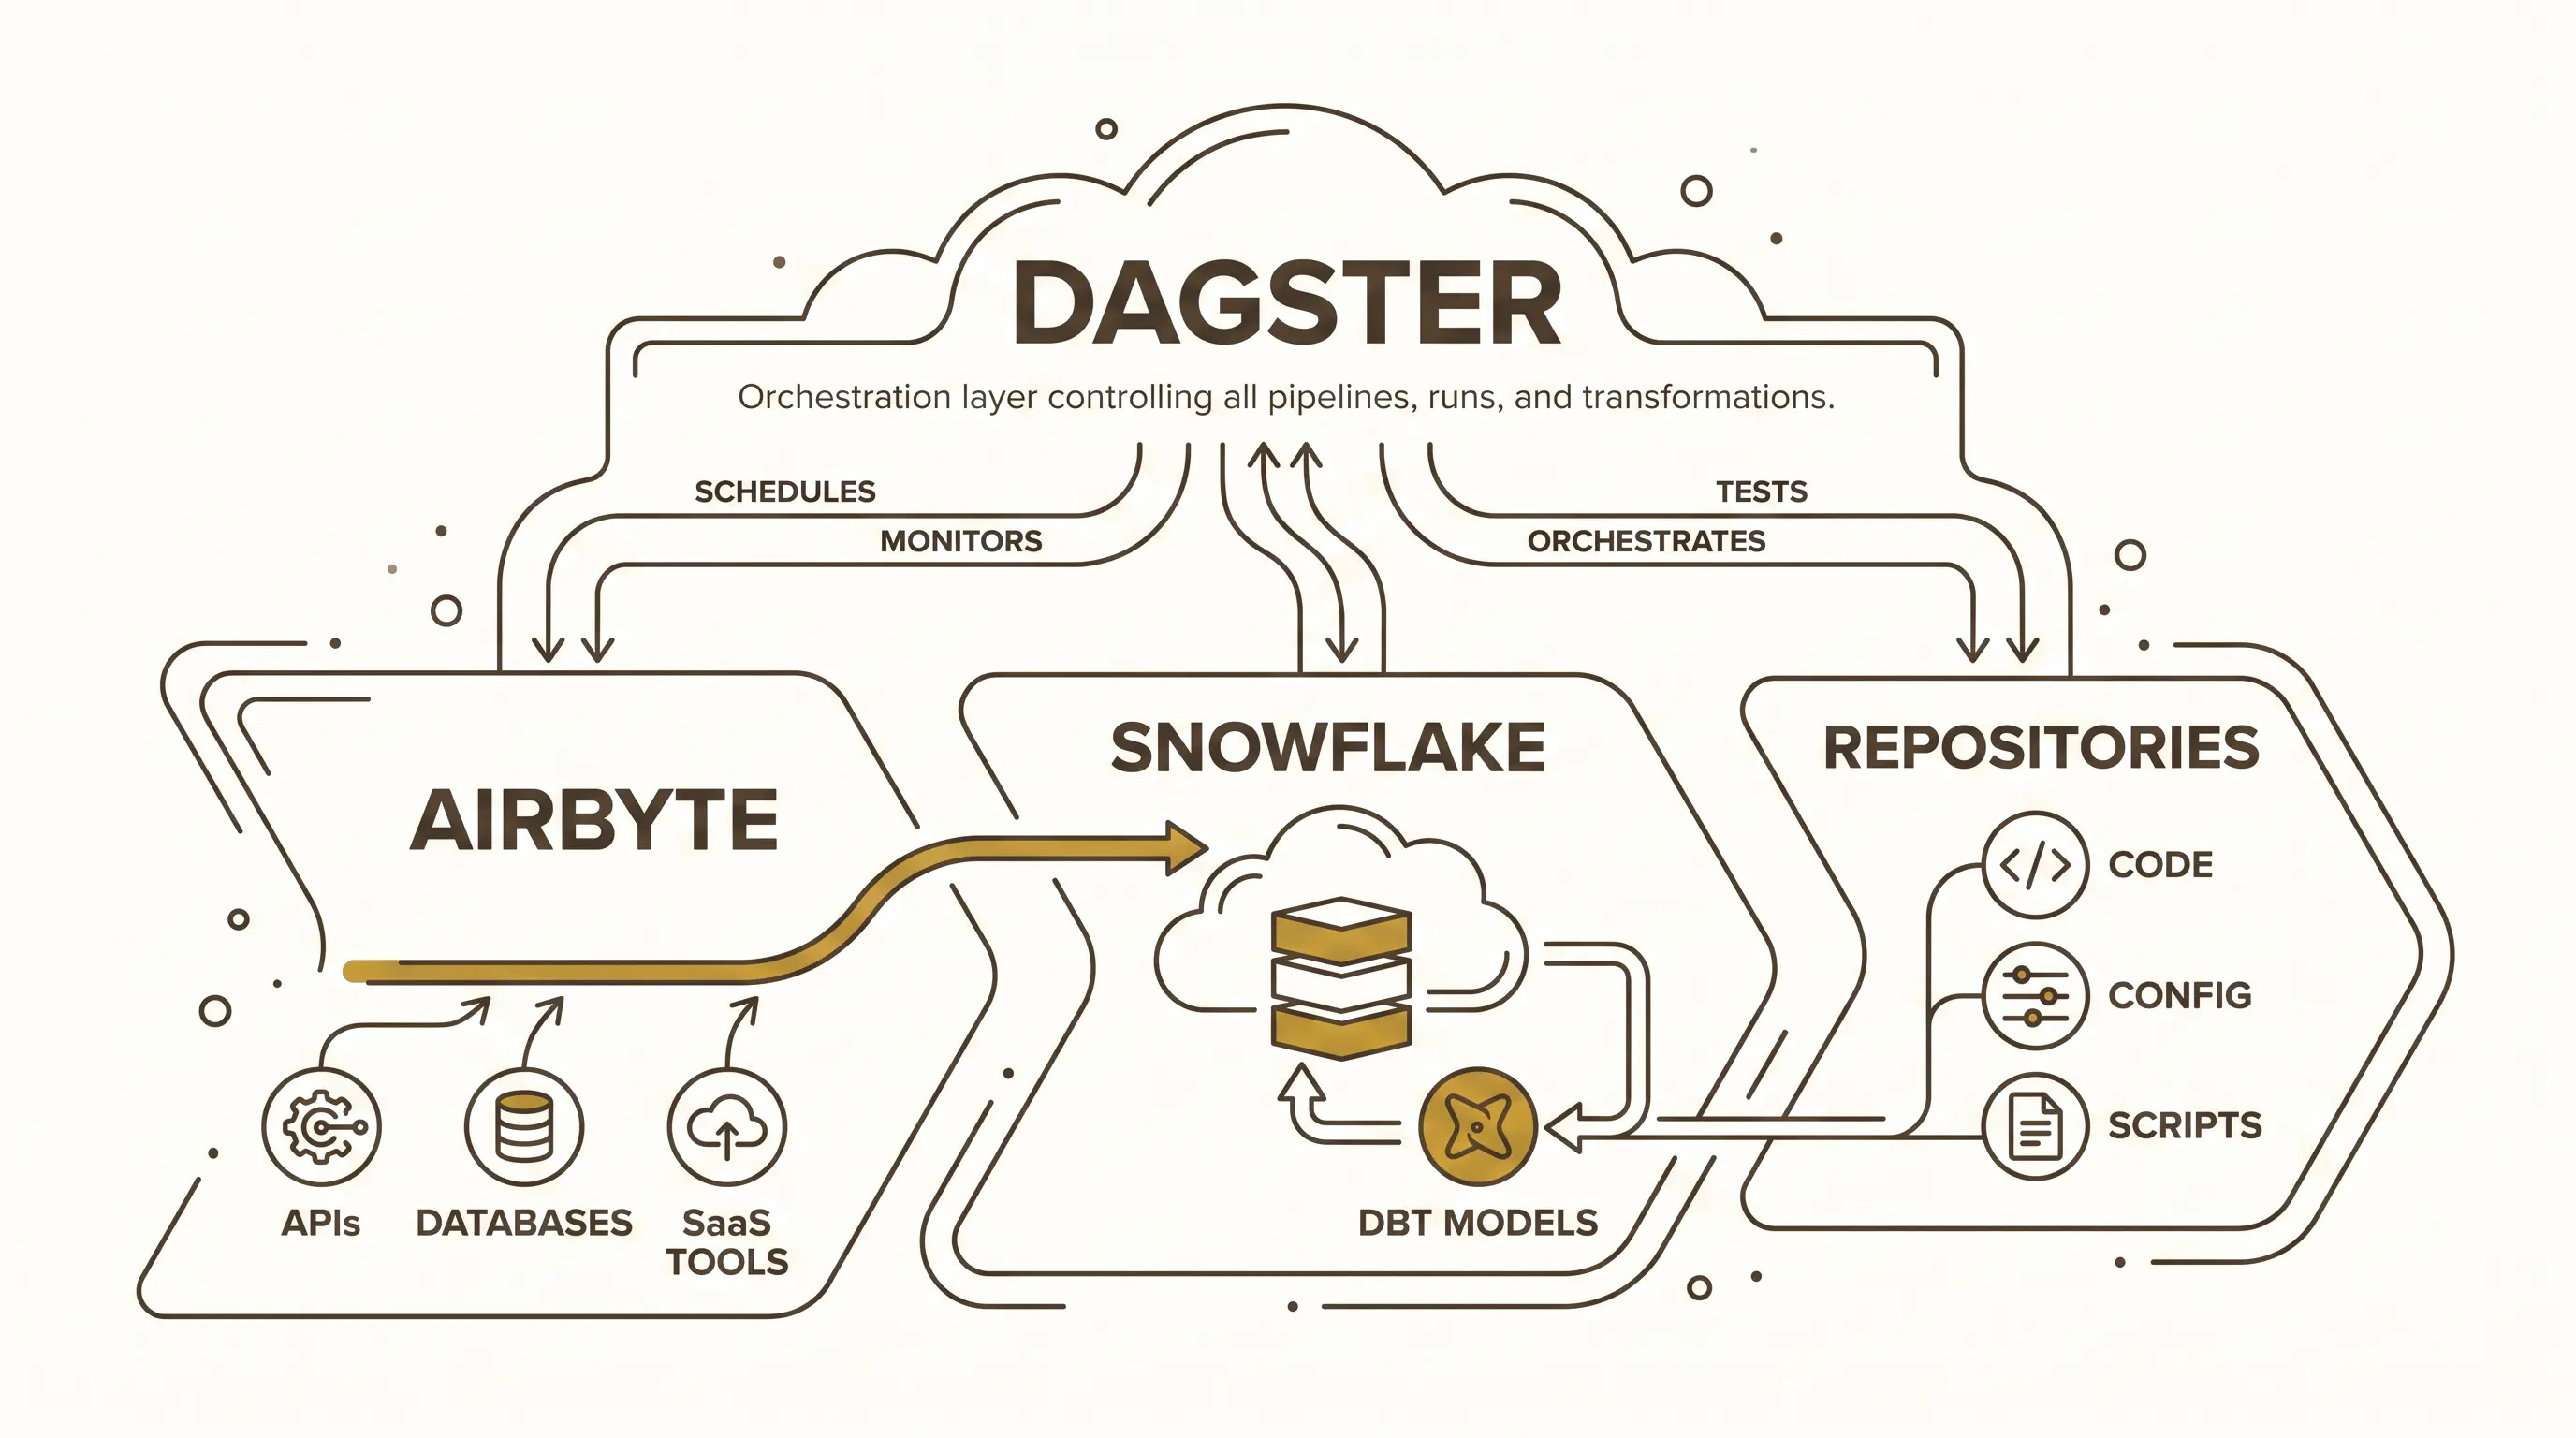
A practical data platform often separates responsibilities across several tools. One useful model is:
- Airbyte collects data.
- Snowflake stores and serves it.
- dbt transforms it.
- Dagster orchestrates the process.
Airbyte acts as the collector. It connects to APIs, databases, SaaS tools, and other sources. A source may expose multiple streams or endpoints. Each stream can often be configured independently: full refresh, incremental sync, deduplication by key, selected fields, and delete behavior.
Delete behavior is a concrete example of why ingestion configuration matters. If a record disappears in the source system, the destination can hard delete it as well. That keeps the destination aligned with the current source state, but it loses historical visibility. A soft delete preserves the record and adds a field indicating that it was deleted upstream. That makes change over time observable.
Snowflake acts as the warehouse. One reason teams use it in cloud data architectures is that storage and compute can scale independently. Increasing compute capacity does not require cloning the whole database or manually load balancing user queries across separate instances.
Snowflake also supports copy-on-write style cloning behavior. A cloned table does not necessarily begin as a full physical duplicate. The clone can share underlying storage until the two versions diverge. That makes cloning useful for workflows where teams need isolated copies without immediately paying the full storage cost of duplication.
dbt handles transformation. Raw data lands in a raw or landing layer. dbt models then shape it into staging, service, or analytical layers that are easier for BI dashboards, APIs, analysts, data scientists, or AI systems to consume.
Dagster sits above this flow. It triggers Airbyte syncs, observes whether data landed, starts dbt transformations, manages dependencies, exposes lineage, and records execution metadata.
Lineage Turns Debugging Into Following Breadcrumbs
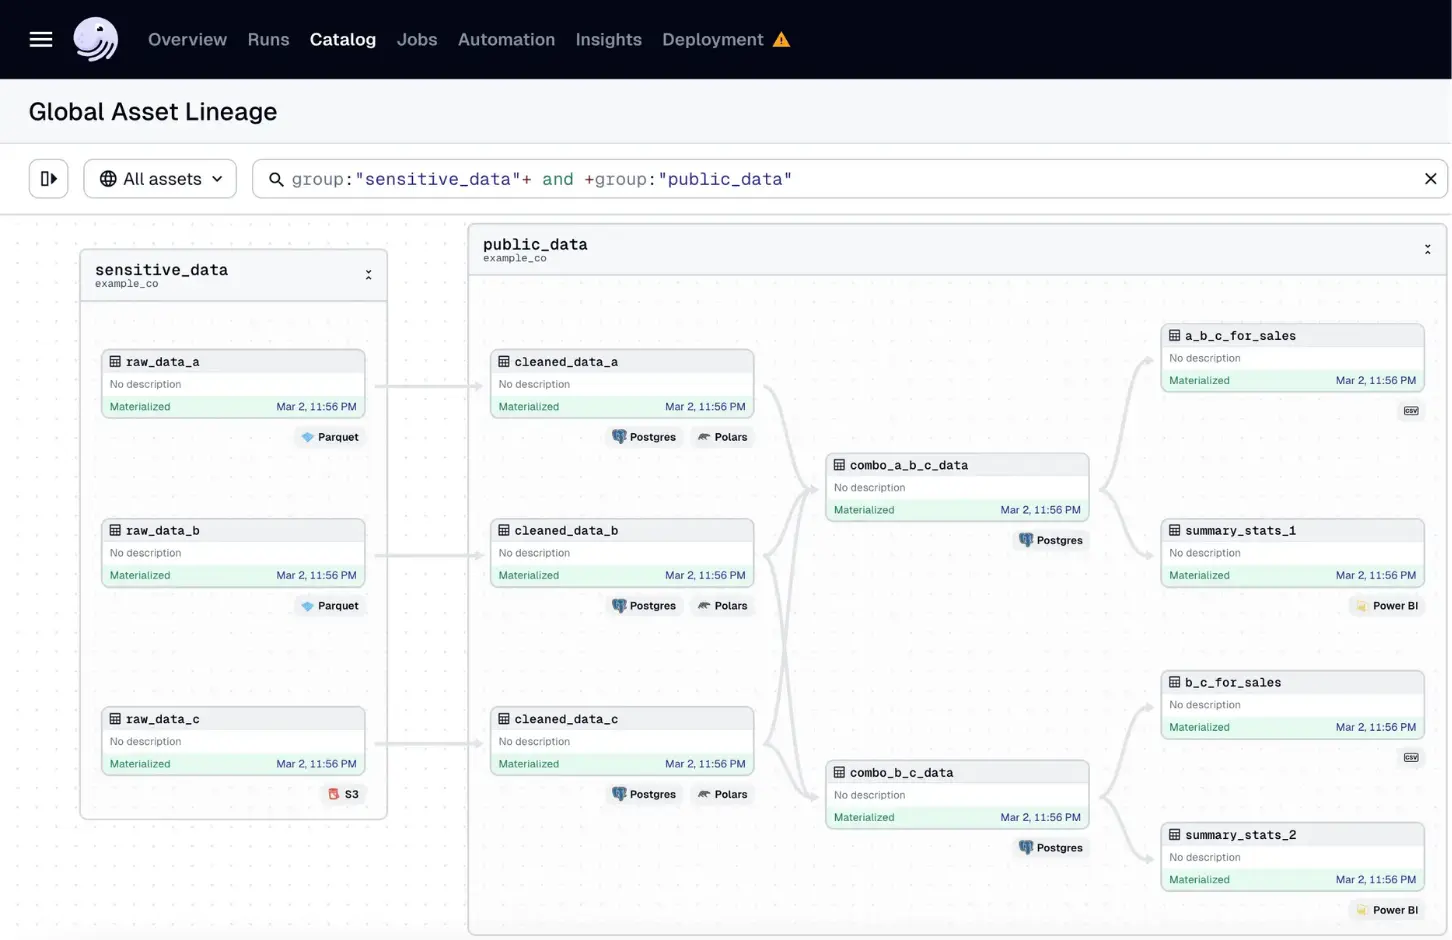
Lineage is one of the most valuable outputs of orchestration. It shows how data moved from source to destination, including each task that read, transformed, joined, or served it.
Consider a pipeline that starts with several Parquet files in object storage. Each file is read by code. The data is transformed with Pandas or Polars. The result is stored in Postgres. Several tables are combined into downstream tables. Those tables feed a Power BI semantic model, which then powers a dashboard.
When a user says a dashboard value is wrong, lineage gives the team a path to follow:
- Which semantic model feeds the dashboard?
- Which table feeds the semantic model?
- Which transformation produced that table?
- Which source files fed the transformation?
- Was the required column present in the source?
- Was it dropped during transformation?
- Was the dashboard refreshed after the table changed?
Without lineage, the same investigation becomes a manual search through scripts, SQL, dashboards, file locations, and job history. With lineage, the system gives engineers a map.
This does not remove the need for debugging skill. It removes the needless uncertainty about where to start.
Sensors: Pipelines That Listen
Schedules are useful, but not all pipelines should run at fixed times. Some should run when data arrives. Orchestration systems support this with sensors.
Sensors allow pipelines to respond to events or conditions. A sensor can watch for a file in Azure Data Lake or S3, detect new records from an API, react to a webhook, or observe messages in a queue. When the condition is met, the orchestrator triggers the pipeline.
This reduces wasted work and makes the system better aligned with reality. A scheduled job may run before data is available and fail unnecessarily. An event-driven pipeline can wait until the upstream event occurs.
The distinction matters in distributed systems where data availability is often not synchronized on a schedule
Freshness, Schema, and Data Quality Checks Belong in the Pipeline
A pipeline should not only move data. It should verify that the data is usable.
Freshness checks answer whether the data arrived on time. If a table must be updated hourly, the pipeline should know when it is stale. If a daily source did not arrive, the system should raise that fact before a user notices a stale dashboard.
Schema checks detect structural changes. If an API removes a field, changes a type, or returns a different shape, the pipeline should fail close to the source instead of letting invalid assumptions spread downstream.
Range and count checks catch domain-specific problems. A row count unexpectedly dropping to zero may indicate an ingestion failure. A value outside an expected range may indicate a source bug, a parsing problem, or a transformation error.
These checks are part of the engineering contract of a data product. A successful pipeline run should mean more than “the script exited with status code 0.” It should mean the expected data was produced, with the expected shape, within the expected time window.
A Small Dagster Asset Shows the Pattern
Let’s dive into Dagster and see how it works.Dagster uses the term “asset” for a unit of computation that produces something valuable, such as a table, file, model, or dataset. Other orchestrators may call this a task. The important point is that the unit of work becomes visible to the orchestrator.
A minimal example starts with ordinary application code: a function that calls a URL, receives JSON, and returns the result. By wrapping that function as a Dagster asset, the same code becomes part of an observable pipeline.
import requests
import dagster as dg
import pandas as pd

# Simple function to fetch data from an API
def get_data():
    response = requests.get("https://api.example.com/data")
    return response.json()

# Creating a Dagster asset
@dg.asset()
def extract_data():
    response = get_data()
    return pd.DataFrame(response)
The asset can fetch data, convert it into a Pandas DataFrame, and return it. At that point, the data exists only in memory. To persist it, the asset can use an IO manager (input/output manager). In a Snowflake-backed pipeline, the IO manager knows how to take the output of the asset and write it to a Snowflake table.
The asset metadata can define the destination name, schema or prefix, and database key. After execution, Dagster can show whether the asset materialized successfully, when it ran, how many rows it produced, what schema it wrote, and where the resulting table lives.
So if we would modify our asset above to write to Snowflake, it might look like this:
import requests
import dagster as dg
import pandas as pd

# Simple function to fetch data from an API
def get_data():
    response = requests.get("https://api.example.com/data")
    return response.json()

# Creating a Dagster asset
@dg.asset(
    io_manager_key="snowflake_io_manager",
    name="table_name",
    key_prefix="schema_name", # dataset
    database_key="database_name"
)
def extract_data():
    response = get_data()
    return pd.DataFrame(response)
This asset now has metadata that tells the IO manager where to write the resulting DataFrame. When the asset runs, the IO manager takes care of writing it to the specified Snowflake table. Dagster then tracks this asset as part of the pipeline, allowing us to see its execution status, output schema, row count, and other metadata.
Orchestrating Existing Microservices
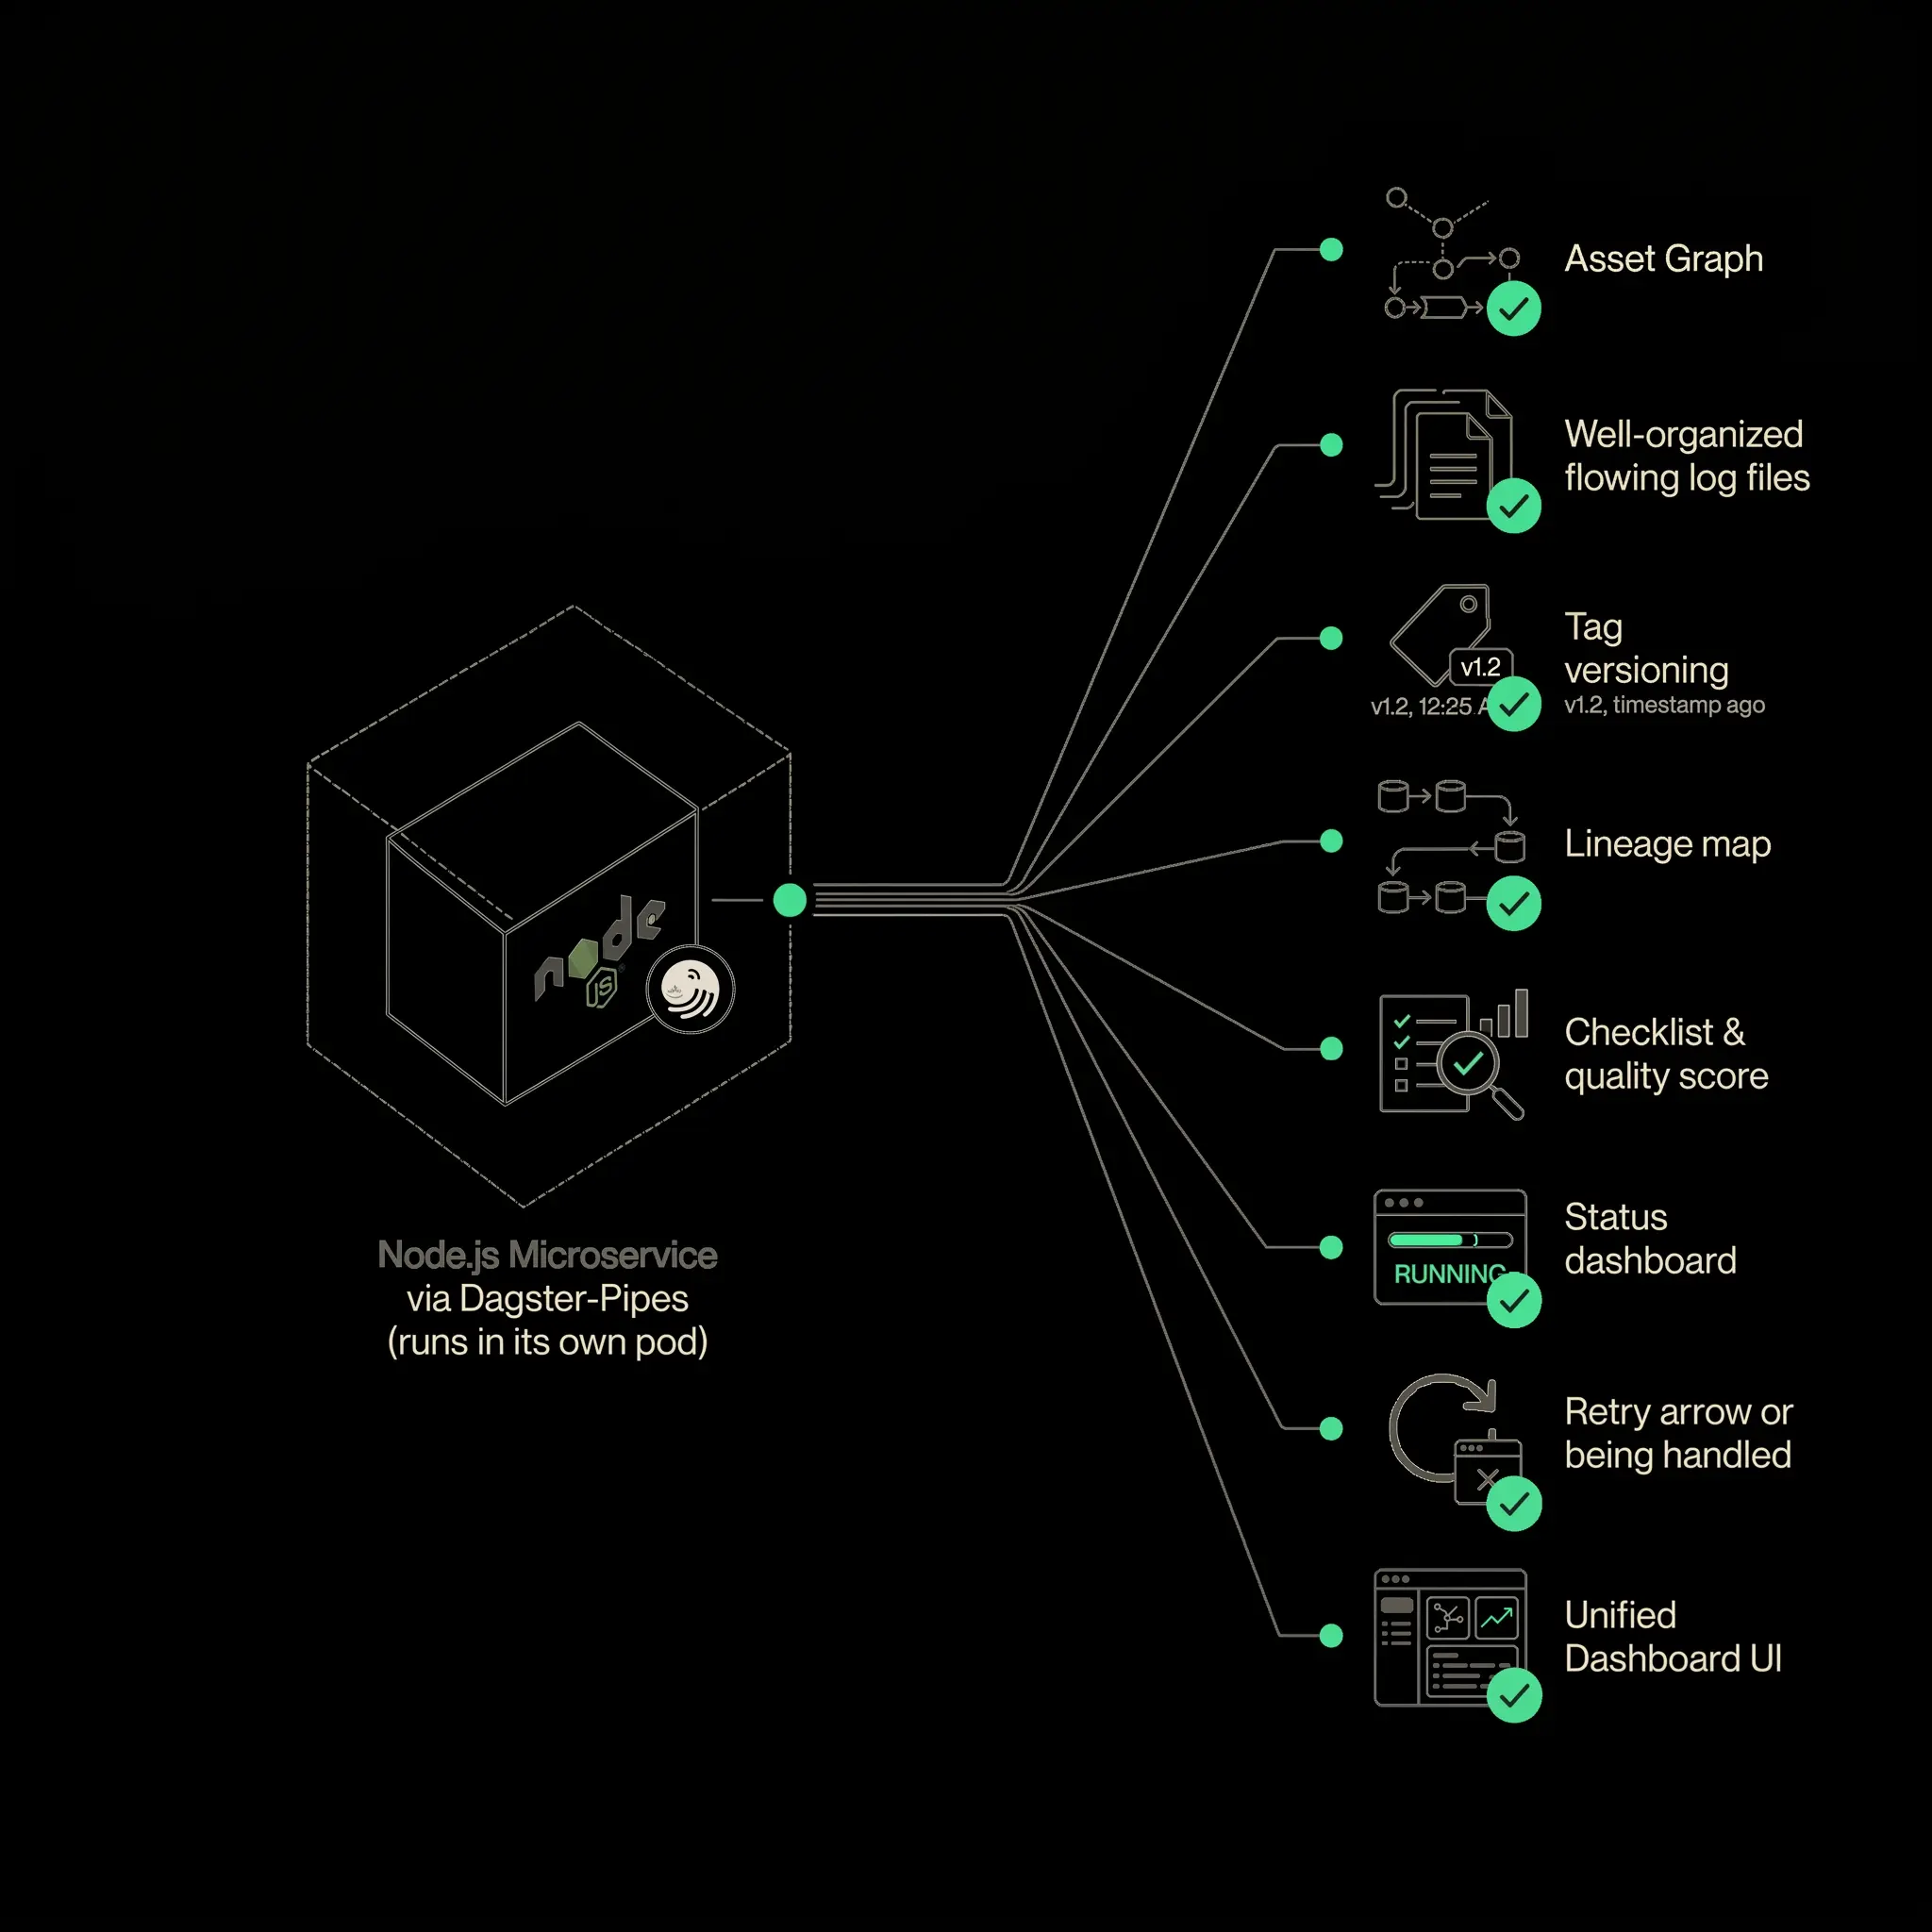
Not all useful data work lives inside the orchestrator. Teams already have services written in Node.js, Go, Java, Python, SQL, or another language. Those services may connect to operational databases, APIs, Kafka, RabbitMQ, files, or third-party tools.
A good orchestration model should not force every team to rewrite existing code. Instead, it should wrap existing execution units and make them observable.
Dagster Pipes is one way to do this. Existing code can run inside a container while Dagster tracks the execution, logs, metadata, and status. The service remains responsible for its domain-specific logic. The orchestrator becomes responsible for coordinating, observing, and reacting.
This is especially useful when the work can be partitioned.
Suppose a microservice can extract data by endpoint, stream, or table. Instead of running one large container that extracts everything, the orchestrator can start multiple containers, each responsible for one slice of the work. Each container becomes a visible unit in the pipeline. CPU and memory usage can be observed separately. Failures can be retried independently. Downstream tasks can wait until all required partitions finish.
If the service cannot be partitioned, orchestration still helps, but the unit of work remains coarse. The orchestrator can run and observe the service, but it cannot provide detailed lineage inside the service unless the service exposes that structure.
This implies an important design implication: if a service is expected to participate in a data platform, it needs to be designed with a command-line interface or execution API so work can be split into meaningful units.
The Real Goal: Domain Data Made Usable
The best data often comes from the teams closest to the domain. Product services know their operational data. Application teams know the meaning of their events. Domain teams understand which fields matter and which edge cases are normal.
The job of a data platform is not to centralize all knowledge inside one team. It is to make domain data usable without forcing every domain team to rebuild the same ingestion, scheduling, retry, lineage, and observability infrastructure.
That is why orchestration matters. It gives domain teams a path into the analytical ecosystem while preserving operational discipline. A microservice, API, database, queue, or file drop can become part of a reliable data pipeline. Once inside that pipeline, the data can be tested, transformed, documented, observed, and served.
The result is not just automation. It is a system where engineers can explain what happened, reproduce failures, trace data back to its source, and make changes without guessing.
Data orchestration is the difference between hoping yesterday’s jobs worked and operating a data platform that can tell you.
Written by